If I Grow Up
Project by Emma Markert
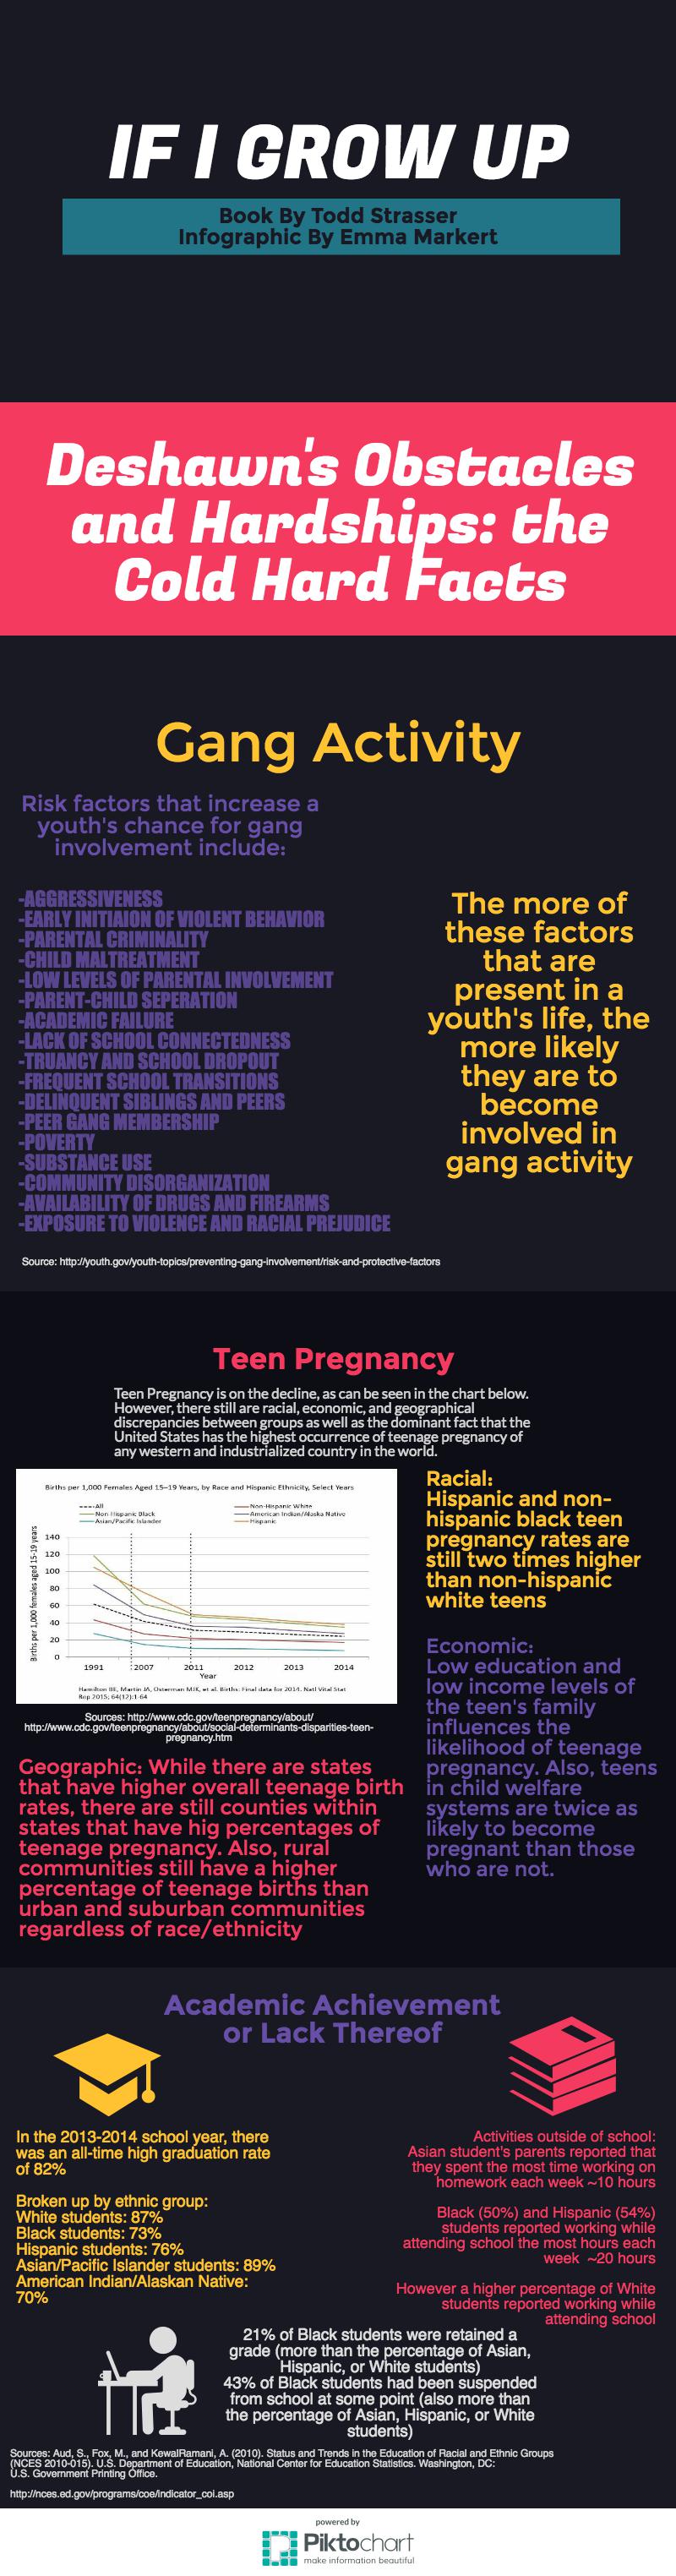
Infographic
During this project, I took the idea of an infographic fairly literally. I wanted to provide facts that supported some of the situations that the main character witnessed and lived in the book. I also wanted to see how easy it would be to access data and facts about those social issues, and it was harder than I was expecting it to be, therefore I greatly respect Todd Strasser for his research into such a complex social community. Something in particular I really enjoyed as a reader about Strasser’s craft is his ability to create an identity that navigated all of those social issues the best that they could, and his ability to not fall into a fairy tale ending where everything turns out okay. DeShawn ended up as the leader of the neighborhood gang, because that was the most logical decision for him, and as a reader, while I may not agree with that life choice, I can completely respect it as a result of Strasser’s ability to create a relatable and sympathetic character.
In my opinion, Piktochart is an interesting medium to create a presentation with. Not being technically savvy myself, I feel it could be difficult to navigate for some students, therefore I would most likely introduce this medium with a tutorial so that students can use the program to its fullest potential. That is the one reservation I have to using multimodal mediums for projects is the time it takes to become familiar with the program, as well as the program serving a purpose rather than just using technology for technology’s sake. Rather than forcing all students to complete the same project using the same medium, I would give them options of what they feel they are most comfortable with.
As I was creating my infographic, I noticed I was creating very text-heavy portions, which is why I decided to use icons in the last section. Personally, I do not mind text-heavy designs, because I like getting lots of info in a short amount of time. However, I can also appreciate other people’s aesthetics not appreciating so much text which is why I tried something different in the last section.